

In machine learning, classification models are predictive models that predict a class label based on an input example. But some classification models do not directly predict a class for an example of the given input but instead report a probability; this classification model is called the Probabilistic classification model.
For example, it might predict that there’s a 75% chance the observation is positive. The natural choice is to assign the observation as positive since the predicted probability is greater than 50%. However, we don’t have to stick to 50%; we can adjust our threshold and only classify observations as positive if our models predict a greater than 90% probability. By increasing the threshold, our model will only make positive predictions when it is peculiar and confident. Conversely, if we lower our threshold, our model will more liberally assign positive labels. Model’s precision and recall are affected by adjusting the threshold.
As we know, there is a tradeoff between precision and recall that becomes more apparent with probabilistic models. If we look at the figure, we can see the ROC-AUC metric is higher precision but lower recall when the threshold increases.
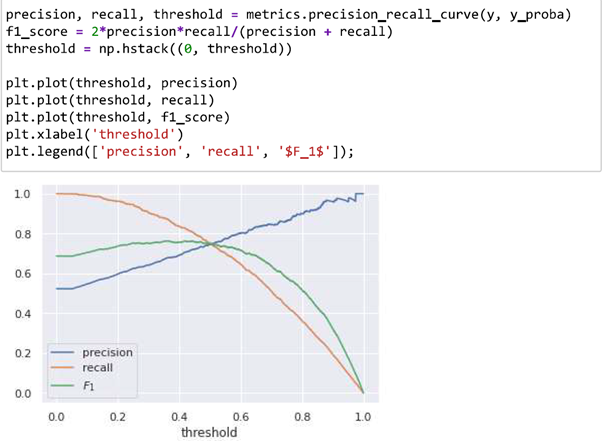
The threshold that yielded the largest F1 score was about 0.36. As such, when comparing the performance of probabilistic classifiers, we need a single metric that is not dependent on the threshold.
Area under the curve (AUC)
The precision-recall curve illustrates the tradeoff for a particular classification model. While there will always be a tradeoff between these two metrics, ideally, the tradeoff should not be severe because the model should not sacrifice a large amount of precision to slightly improve recall. We can visualize the degree of the tradeoff by plotting what is known as a precision-recall curve.
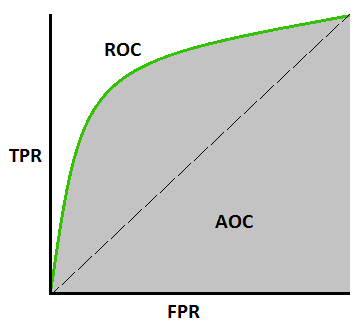
We generally want a model with less tradeoff between precision and recall, resulting in a curve with less drop with increasing recall. Geometrically, it is better to have a model with a larger area under the curve, AUC, of its precision-recall plot. AUC is the measure of the ability of the classification model to distinguish between classes. It is considered that the higher the AUC better the performance of the classification model at distinguishing the positive and negative classes. In sci-kit-learn, the AUC can be calculated using the metrics.auc function. In addition to AUC, the ROC-AUC metric is based on the receiver operator curve (ROC), performance measurement for the classification models at various threshold settings. The ROC plots the true positive rate against the false-negative rate.
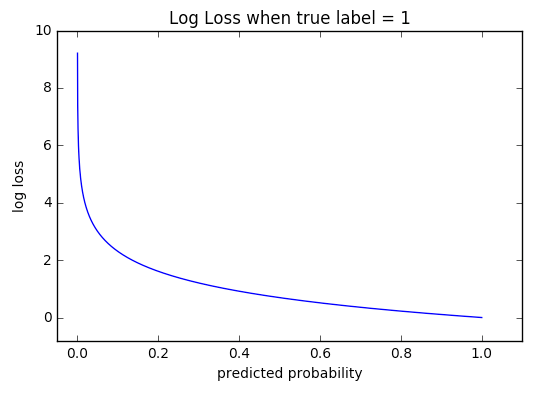
Log loss
The log loss function is a metric that is often used for optimizing probabilistic classifiers, sometimes referred to as cross-entropy. Log loss takes into account the uncertainty of your model’s predictions, something accuracy does not do. The equation for the log loss is:
Where yi is the class label of observation, either 0 or 1, and pj is the probability of the observation in class 1—the lower the log loss, the better the model.
The log loss is harder to interpret than other metrics such as accuracy because it measures whether the model will correctly classify an observation and rewards the model if its confidence of a correct prediction is high. Conversely, it will severely penalize the model for being overly confident in a wrong prediction.
Let’s take an example to understand log loss; a model will have a lower log loss if it predicts a probability of 95% for observation of class 1 than if it had predicted 60%. Thus, two models can have the same accuracy yet have different log losses. Despite being slightly harder to interpret, it reveals more information about a model’s performance than accuracy.
Looking for an in AI/ML consultant?
Our experts will help you in getting the best of the machine learning.
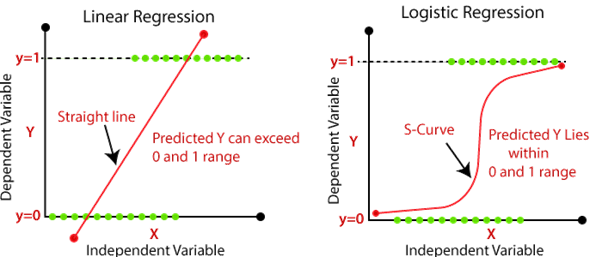
Logistic regression
The logistic regression model is the classifier version of linear regression. It is a probabilistic model that will predict probability values that can then be used to assign class labels. The logistic regression model works by taking the output of a linear regression model and then feed it into a sigmoid or logistic function. Mathematical representation of this is
Where
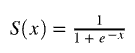
Here the sigmoid function is used because it maps values that range from positive to negative infinity to values that only range from 0 to 1. Thus the output of the sigmoid function can be interpreted as a probability.
How ISmile Technologies Help:
- Expertise in Machine Learning:
ISmile Technologies has a team of experts with extensive knowledge and experience in machine learning, including probabilistic classification models. This expertise enables them to offer guidance and assistance in building and optimizing such models. - Data Preparation and Analysis:
Developing a probabilistic classification model requires data preparation, which involves data cleaning, preprocessing, and analysis. ISmile Technologies has a strong foundation in data science and analytics, enabling them to help clients with data preparation and analysis. - Model Selection and Optimization:
ISmile Technologies helps clients in selecting the right probabilistic classification model based on their use case and requirements. We can also assist in optimizing the model’s performance, such as improving accuracy or reducing false positives. - Implementation:
Once the probabilistic classification model is selected and optimized, it needs to be implemented in a production environment. ISmile Technologies has experience in deploying machine learning models in various production environments and can help clients with a seamless implementation. - Monitoring and Maintenance:
After implementation, the probabilistic classification model needs to be monitored and maintained to ensure that it continues to perform as expected. ISmile Technologies can help clients with model monitoring and maintenance, including updating the model as new data becomes available.
Get in touch with us to schedule a free introductory call to discuss your AI/ML requirements in detail. Schedule a Free Evaluation.