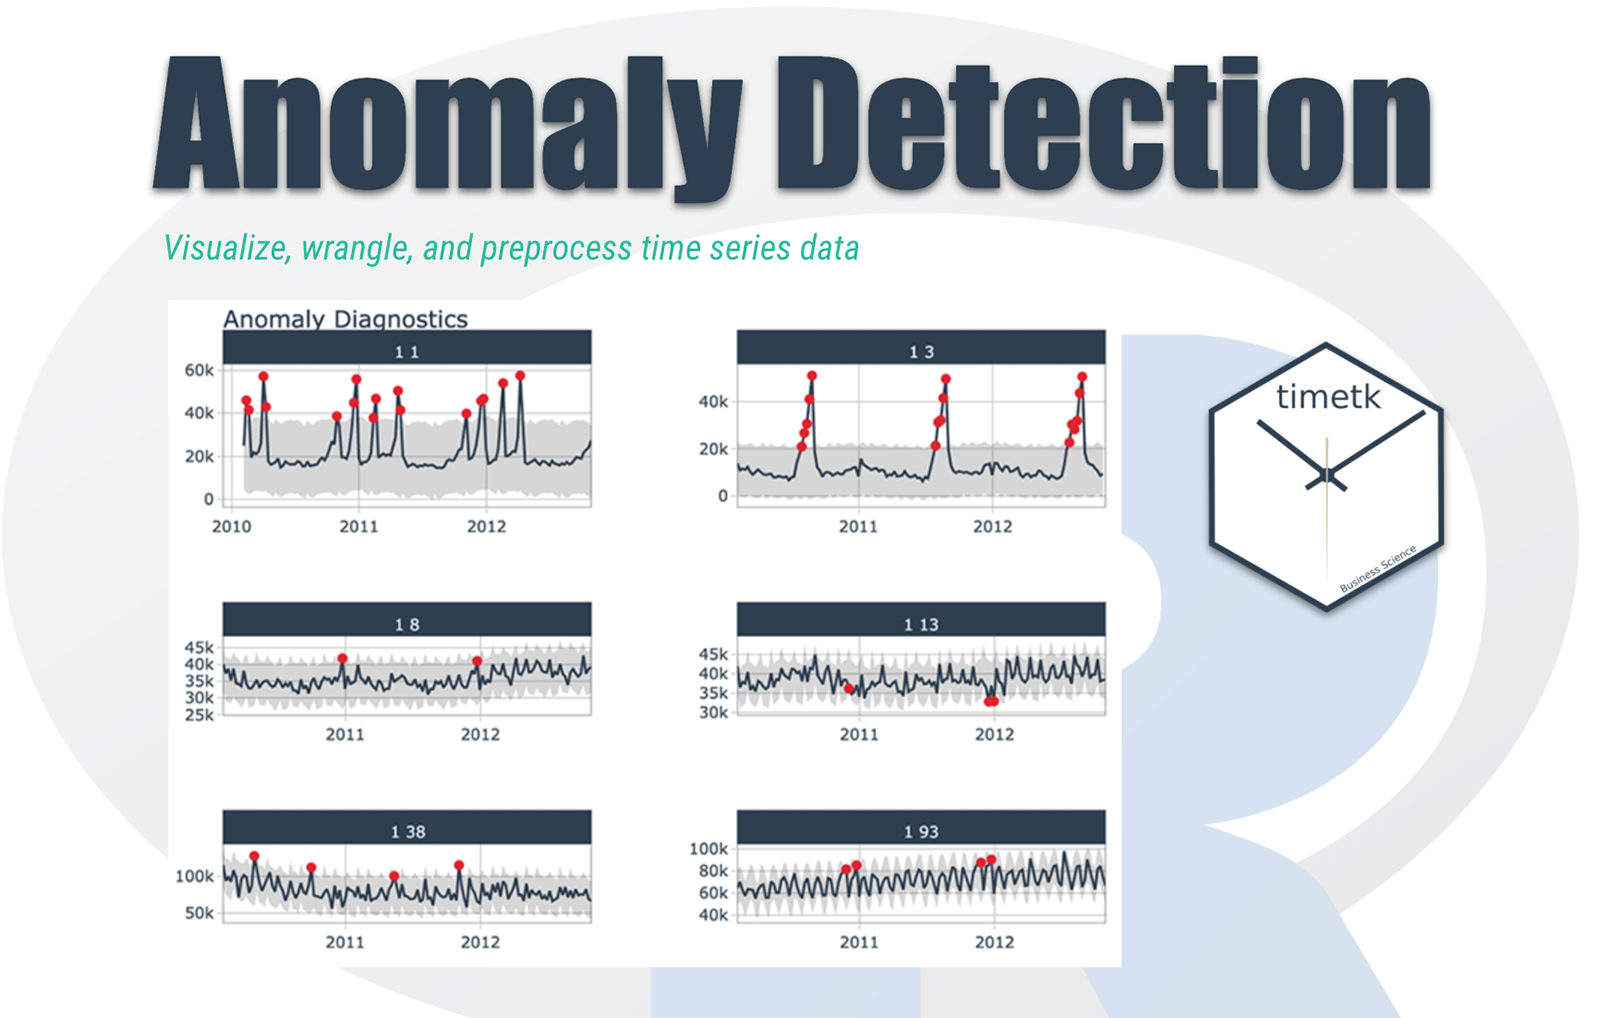

Anomaly detection can be applied to a time series where we want to create a baseline model and determine the deviation of the observations with the baseline. From deviation, we can get information such that if it is large enough, the observation is deemed abnormal and is flagged.
In general, novelty and outlier detection does not tell us why something is possibly an outlier, but the conditions and causes led to an unusual observation. For example, generally, there are cases where we observe server logs; anomalous observations may result from some equipment or code breakdown or something malignant like a security breach.
What should be your plan of attack be for analysing the time series?
So, generally, we visualize the data; after that, our goal is to generate the baseline model, so we can ask ourselves if there is any drift, and if present, we have to remove that from our data set.
The other thing we need to ask ourselves is some periodicity in our dataset. We have to find those and remove them from our model, so the residual is left behind; we can do some other modelling on those residuals. So this is the overall plan of attack.
Fourier Analysis
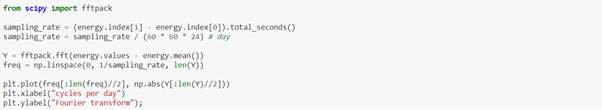
It is hard to tell when there are periodic behaviours in the time series where we can better spot the dominant frequencies that support the time series using Fourier analysis. So here, I have taken a Fourier analysis code to give an idea about the dominant frequencies.
From this graph, we got to see that these time series consist of four dominant frequencies, which are as follows:-
- Daily
- Twice-daily
- Three times a day
- Four times a day.
If we rephrase it, it would be 6, 8, 12, and 24 hours.
Output Graph:
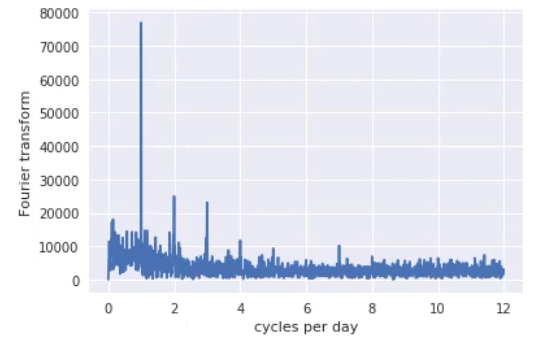
From this graph, we got to see that this time series has four dominant frequencies: daily, twice-daily, three times a day, and four times a day. In other words, 6, 8, 12, and 24 hour periods.
Initial baseline model
Generally, we create an initial baseline model to get an idea of the data and know whether the initial baseline model is adequate for the time series. Generally, before using the initial baseline model, we create some custom transformers (if needed) to work with our pandas’ time-series data. Most custom transformer is used to generate Fourier components, transform Date Time objects into a unit of time, etc.
So after using the custom transformer and the initial baseline model, the residuals are generated to reveal whether the time series has a lot of shock events, a sudden increase in energy usage probably due to sudden and short use of products. So there’s a need to analyse the residuals for any temporal correlations.
Noice Based Features
The first thing we want to unveil is the correlation of past residuals with current values. An autocorrelation plot will inform us whether the time series elements are positively correlated, independent of each other, or negatively correlated. In short, it tells the characteristic time scale of the process to guide us when generating noise-based features.
z-Score
Since there is little temporal correlation with residual values, we assume that the residuals are independently sampled from the same distribution. Given this probabilistic perspective, we can quantify the degree of an anomaly to each observation if we know the distribution the residuals get sampled from.
If the distribution has one peak, there is a lower probability of observing values far from the peak. The z-score is a relative measure of how far away a value is from the mean, normalized by the standard deviation.
How should we decide the appropriate z-score cutoff?
If we set the z-score large, it will increase the range of standard points or inliers, and if we set the z-score small, it will decrease the range of standard points. So if we view there is no perfect answer for this, we should consider that it all depends on the precision and recall we want in our analysis.
Rolling z-score
The calculation of the z-score relied on the entire time series for calculating the mean and standard deviation. We will usually be streaming observations for anomaly detection with time series, and the entire series will not be available.
Instead, we can calculate the z-score on a window of observations rather than the whole time history. The advantage of rolling z-score is that not hold a large amount of data in memory, and it also reflects the fact that it is better to use current values. However, the observation is uncommon, and the rolling z-score is more adaptive to recent changes in the process.
Conclusion
So, we have learned about how anomaly detection gets used in a time series. A deep analysis would be a necessity while analysing every aspect of time series. We have learned how Fortier analysis, Z-score, initial baseline model, and noise base features can turn out to be so valuable while planning to analyse a time series. Moreover, the helpful method of finding out the cut-off of Z-score can be applied to the practical methods using anomaly detection time series.
To get the first free consultation for discussing Anomaly detection gets used in time series, click here.