

What is a dashboard?
A dashboard is a graphical user interface that often provides at-a-glance views of key performance indicators (KPIs) relevant to a particular objective or business process. In another usage, “dashboard” is another name for “progress report” or “report” and is considered a form of data visualization.[1]
A cloud dashboard is a dashboard that you can build and access on a web browser. Compared with on-premise software, it has key advantages, such as easier deployment, little IT support, and access on multiple devices.
What is Google cloud?
Google Cloud Platform (GCP), offered by Google, is a suite of cloud computing services that runs on the same infrastructure that Google uses internally for its end-user products, such as Google Search, Gmail, Google Drive, and YouTube. Alongside a set of management tools, it provides a series of modular cloud services, including computing, data storage, data analytics, and machine learning. Registration requires credit card or bank account details.[2]
How to build a dashboard in Google cloud
Step 1: Determine the data source of BigQuery
First, log in to the editor of BigQuery, and after setting the data set, click the “resources” tab on the left side of the editor page to identify the source of the uploaded data.
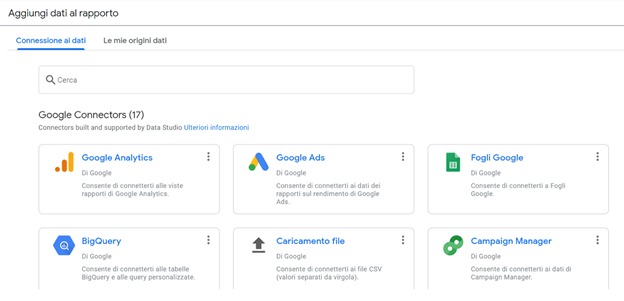
Step 2: Pull the data to the dashboard in Data Studio
Users can jump to their Data Studio account and click the plus sign to start a new report or choose various data connectors
Step 3: Use Google Data Studio to explore the data
In general, the operation of Data Studio is effortless, just like an intuitive drag-and-drop interface; users can choose from different chart types and style/format them according to the available data.