


Before we dive into the use of BigQuery in preparing Google Data Studio, let’s take a moment to briefly have an idea about what is BigQuery, what is Google Data Studio and Google Data Studio BigQuery connector.
What is Big Query?
Big Query is an analytics data warehouse that lets users analyze large amounts of data in almost near real-time. Think of it like running a query in SQL, only at a much larger scale. Google Cloud provides it and, therefore, is a cloud-based service that doesn’t require the user to set up or manage the infrastructure.
However, with such a powerful data analytics tool, there comes the issue of interpreting all of that data, which is where Data Studio comes in.
What is Data Studio?
Data Studio is another Google service that allows you to turn data into understandable graphs and reports.
What is DataStudio BigQuery Connector?
So, the Google data studio BigQuery connector helps access the data from your BigQuery tables within Google data studio.
Before we dive into the use of BigQuery, we just have a piece of information that BigQuery is automatically enabled in new projects and a preexisting project; we can activate it using the BigQuery API.
The Steps:
- Creating a Data Source: The first step is to create a data source for the report in Google Data Studio. Here we can define a report as a collection of one or more data sources.
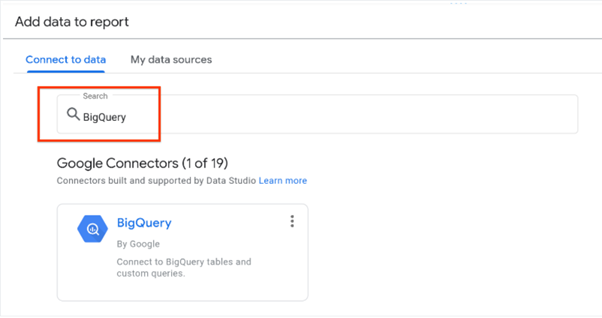
- Connect to Big Query: After opening a new blank report in Google Data Studio, there will be a ‘add data to report’ tab, and in that, you can search ‘BigQuery.’ In the Google connectors section, you will see a BigQuery box, hover over it and select it.
After clicking on it, the configuration panel appears; select ‘PUBLIC DATASETS,’ then select dataset samples, choose your Billing project, and click on connect. A field panel will appear which contains all the dimensions and metrics from the data set.
- Visualizing the data: After we have a data source for Data Studio, we can now focus on visualization. To create a chart of any kind, simply click on the dataset in your report and click “Insert.” From there, you can see an enormous drop-down list of charts to choose from. Here is an example from a pre-set dataset from Google of different populations of countries.
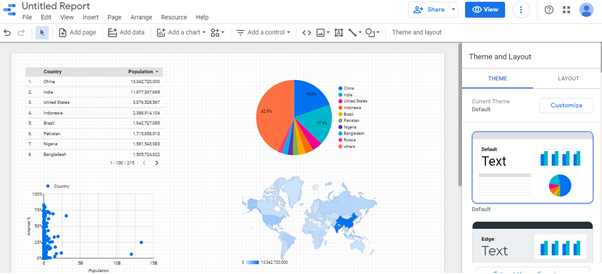
As we can see, there are lots of different charts available to use from Data Studio. Even more, once we select a particular chart, on the right side, there will be two types of editing tools, one for data and one for design. Let’s look a the pie chart as an example:
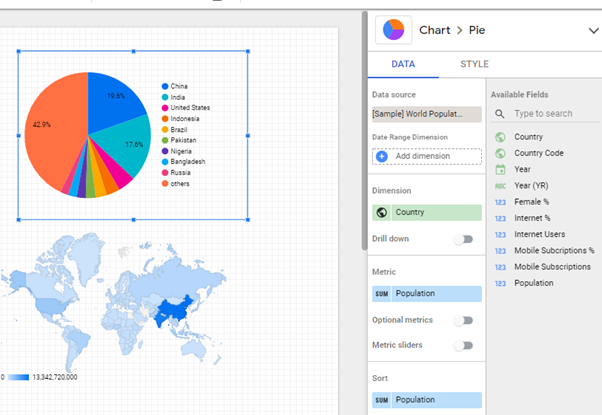
We can see the dimensions by which the populations are measured, change the data metrics, and sort the countries into different orders. From the style side, we can decide how many slices the chart has, the colors, the font and size of the legend, and much more.
This way, we can use BigQuery to add a database to Google Data Studio and use it for visualization purposes.
So, if you are interested in more detail of these steps, here’s the link of the source that I have used for the blog
https://cloud.google.com/bigquery/docs/visualize-data-studio
https://support.google.com/datastudio/answer/6295968?hl=en#zippy=%2Cin-this-article
This is Harshit Dave, Data Science Intern at iSmile Technologies. Thanks for reading.