

The four golden signals of monitoring in SRE are
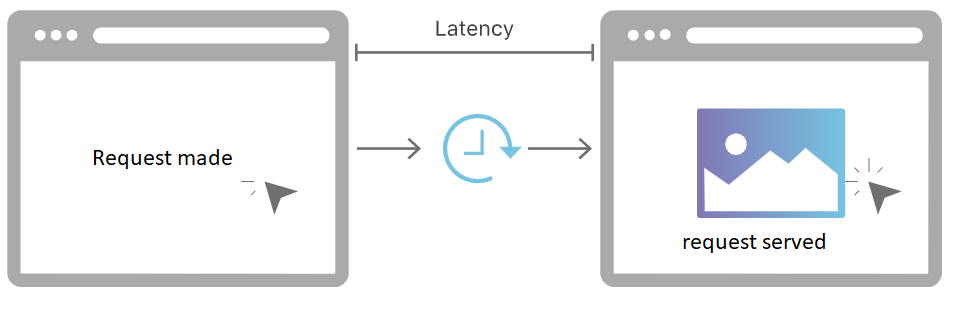
Latency- It is the time that is spend between the user actions and the corresponding response. This is basically the time required for servicing a request. Example- the delay when the user clicks on the web page link and the browser shows the web page. Calculating and monitoring latency can help in knowing the overall performance of your systems. Latency calculations may go wrong if you factor in HTTP 500 or failed requests into the calculation. So tracking error latency holds equal importance. The lower the latency, the better communication occurs between the group of connected devices in the organization and hence the process speed increases which in turns makes the organization more efficient and helps in speeding up time to market.
Traffic– It is the measure of how much demand or the volume of requests made on your system or servers. It is basically the stress created on your system from users or transactions made in your service. Any spike in traffic can increase the stress on your system and servers causing them to respond slow. By monitoring the traffic, you can understand the experience your end users are gaining. There are various system specific metrics for monitoring the traffic like
- Network I/o rate / Concurrent systems- For audio streaming traffic
- Transactions and Retrievals/ sec- For key value storage systems
- Average response time (ART), Peak response times (PRT)- Servers
- Server Response Time (SRT), Bandwidth utilization and Round-Trip Time- Networks
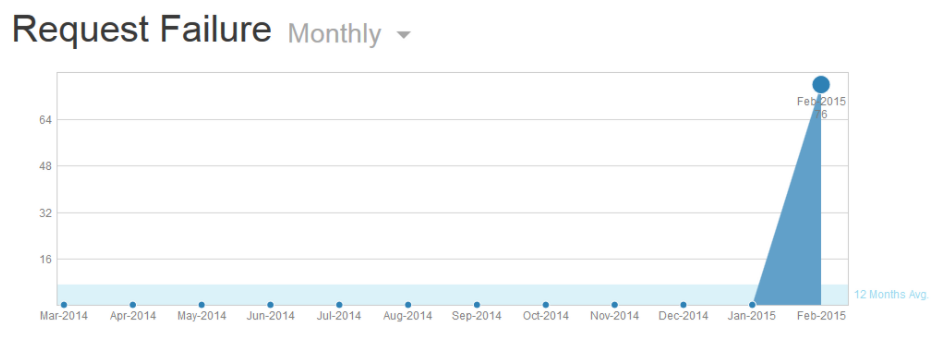
Errors– It generally includes calculating the rate of requests that fails. There are various protocol response codes for failed requests either from the clients’ side or servers. Some of them have been mentioned below.
- Common 4XX client Error
- 400 Bad Request
- 401 Unauthorized
- 402 Payment Required
- 403 Forbidden
- 404 Not Found
- 405 Method Not Allowed
- 406 Not Acceptable
- 407 Proxy Authentication Required
- 408 Request Timeout
- 409 Conflict
- 410 Gone
- 411 Length Required
- 412 Precondition Failed
- 413 Request Entity Too Large
- 414 Request-URI Too Long
- 415 Unsupported Media Type
- 416 Requested Range Not Satisfiable
- 417 Expectation Failed
- 418 I’m a teapot (RFC 2324)
- 420 Enhance Your Calm (Twitter)
- 422 Un processable Entity (WebDAV)
- 423 Locked (WebDAV)
- 424 Failed Dependency (WebDAV)
- 425 Reserved for WebDAV
- 426 Upgrade Required
- 428 Precondition Required
- 429 Too Many Requests
- 431 Request Header Fields Too Large
- 444 No Response (Nginx)
- 449 Retry With (Microsoft)
- 450 Blocked by Windows Parental Controls (Microsoft)
- 451 Unavailable for Legal Reasons
- 499 Client Closed Request (Nginx)
- Common 5XX Server errors
- 500 Internal Server Error
- 501 Not Implemented
- 502 Bad Gateway
- 503 Service Unavailable
- 504 Gateway Timeout
- 505 HTTP Version Not Supported
- 506 Variant Also Negotiates (Experimental)
- 507 Insufficient Storage (WebDAV)
- 508 Loop Detected (WebDAV)
- 509 Bandwidth Limit Exceeded (Apache)
- 510 Not Extended
- 511 Network Authentication Required
Apart from this if the protocol response codes are not enough to represent all failure conditions of requests, internal protocols may be developed for tracking failure status by the organization.
Comprehensive detailing of all the errors and the request failures can help an organization in understanding the user experience and the reliability of systems and networks
Saturation– Saturation generally refers to the capacity or utilization ability of your service or systems. It generally takes into consideration the degradation points of the systems before it hits the 100% utilization mark. Monitoring saturation can help the SRE team develop a benchmark for system/service performance and health.
iSmile technologies offers free consultation with an expert, talk with an expert now